
Diagramming Software • Independent Review
Lucidchart Review 2026: I Tested the Editor, the AI Diagram Generator, and the Real Pricing
A hands-on, no-fluff verdict from someone who actually built diagrams in it — not a rewritten spec sheet.
By Oyekale Olawale | Updated August 2026 | 11 min read
⚡ Quick Answer
Lucidchart is still the best all-around diagramming tool for teams in 2026 — free for 3 documents, $9/month for Individual, $10/user/month for Team. I built a flowchart, tested the AI diagram generator twice, and pushed the editor into a cluttered network diagram to find where it breaks. Verdict: the drag-and-drop editor is genuinely fast, the AI generator needs a second prompt to be usable, and yes — contrary to what a lot of older reviews still claim — Lucidchart does have a REST API.
I’ve reviewed a lot of software on Websites2Know, and diagramming tools are a category I’m genuinely picky about, because the failure mode is invisible until you’re three layers deep into a project and the tool starts fighting you.
So instead of listing Lucidchart’s feature page back at you — the way I did when I tested Semrush’s toolset a few months back — I opened a blank canvas, built something real, broke a few things on purpose, and wrote down exactly what happened.
What Is Lucidchart, Exactly?
Lucidchart is a browser-based diagramming tool built by Lucid Software, a company that’s been at this since 2008 out of South Jordan, Utah. It’s the flagship product in the Lucid Suite, sitting alongside Lucidspark (a whiteboarding tool for messier brainstorming). Where a lot of people get confused is treating it like a static drawing app — it isn’t. You can link a live Google Sheet or CSV to a diagram and have the shapes update themselves when the data changes, which is a meaningfully different category of tool than something like a basic flowchart maker.
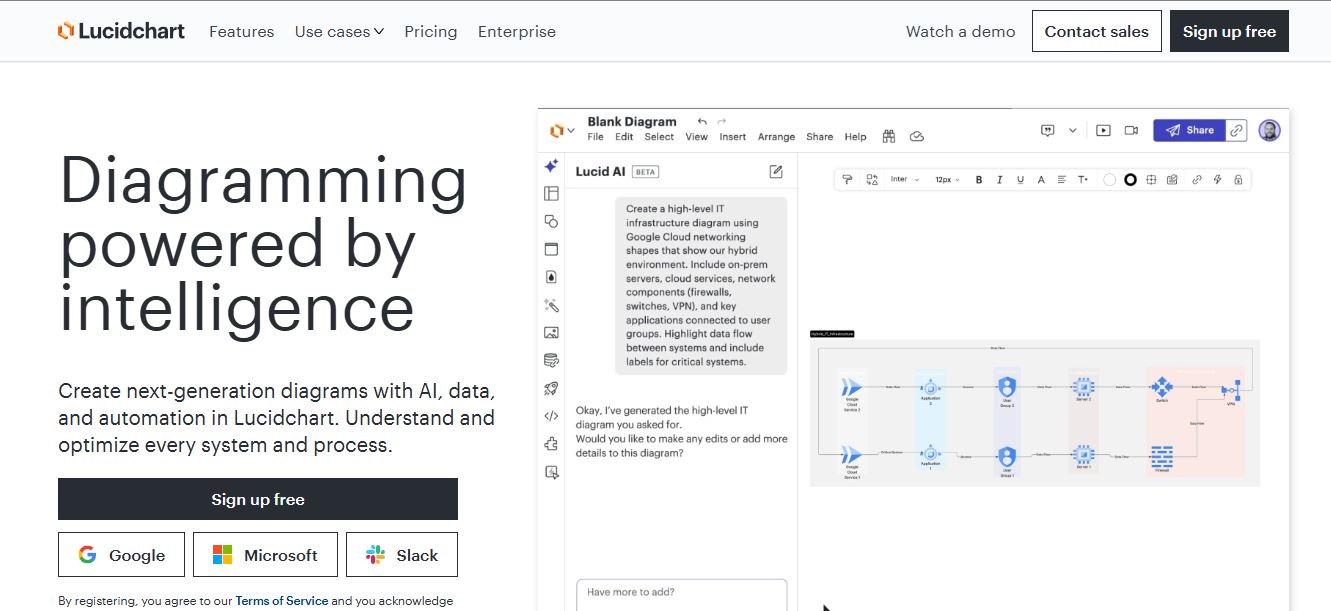
Lucidchart’s homepage — the entry point before you land in the actual editor.
How I Tested It
My testing approach for any diagramming or productivity tool is the same one I used when I dug into Guidde’s screen-recording workflow: I don’t read the marketing copy first. I open the app cold, try to accomplish something a real user would need — a flowchart, an org chart, a floor plan — and note every point of friction as it happens.
For Lucidchart, that meant starting at the dashboard, working through the templates, building a basic flowchart from scratch, stress-testing the AI diagram generator with a genuinely complex prompt, and then digging into the formatting and organization tools that separate a serious diagramming tool from a toy.
My honest first impression: the editor looks a little intimidating the moment it loads. There’s a lot packed around the canvas. That feeling faded fast once I started clicking around, but it’s worth flagging up front for anyone who’s never used a tool like this before.
The Dashboard and Templates
I always start new users at templates rather than a blank canvas, and Lucidchart’s library is genuinely one of its strongest assets. The free plan gives you 100 professional templates; upgrade and you’re looking at 1,000+. There’s coverage for org charts, HR processes, meeting facilitation, workshop kits — the kind of practical business content most competitors treat as an afterthought.


Here’s my one real complaint about the template flow, and it’s small but it’ll trip you up: opening a template always spins up a brand-new document. It doesn’t drop the template content into the document you already have open. If you’re mid-project and want to borrow a section from a template, you have to open it separately and copy elements over manually. Minor annoyance, not a dealbreaker, but it’s exactly the kind of friction a spec sheet won’t tell you about.

Building a Flowchart from Scratch: The Editor, Shapes, and Connectors
To really understand the tool, I moved to a blank document. The canvas is your workspace, and — small tip that made a real difference — I found the mouse wheel is by far the fastest way to zoom, faster than hunting for the zoom buttons in the corner.
I also poked around document settings, and there’s more control here than I expected: background color, measurement units, page size, orientation, margins, grid style, and snapping behavior. The Infinite Canvas option is genuinely useful if you don’t want to be boxed into a page — flip it off and you can work against a standard A4 page if you’re prepping something for print.

The left-hand panel — this is where I spent most of my actual working time.
This left-hand panel is where the actual diagramming happens. Drag a shape onto the canvas, drag from a connection point on one shape to another to link them, and double-click any shape to add text. Lucidchart ships with standard shapes and dedicated flowchart shapes out of the box, and you can pull in additional libraries on demand — I searched for a floor-plan library specifically and instantly got access to furniture, fixtures, and structural elements I wouldn’t have had otherwise. You’re not stuck with whatever ships by default, which matters more than it sounds like it should.

I put this together into a simple content-planning flowchart for YouTube video ideas — categories like tutorials and comparisons branching down into individual video concepts. Nothing sophisticated, but it was more than enough to see how quickly an idea turns into something visual here. From a blank canvas to a readable flowchart took me under fifteen minutes.

Two things worth flagging for anyone about to try this themselves. First, hold Shift while resizing — skip it and a circle turns into an oval by accident more often than you’d think, and it’s an easy habit to build once you know it exists. Second, flowchart-specific shapes behave differently from regular shapes. Some connections come pre-labeled with “Yes” and “No” automatically. It threw me off the first time it happened, until I realized it was tied to the specific shape type I’d grabbed, not a bug.
🗺️ From Blank Canvas to Finished Diagram
No credit card required for the free plan.
I Tested the AI Diagram Generator Twice — Here’s the Honest Result
This is the feature that pulled most of my attention, and it’s had real investment from Lucid this year — release notes from Lucid’s own community changelog show fishbone diagrams, radar charts, image-to-diagram replication, and the ability for Lucid AI to edit diagrams it didn’t originally generate, all shipped within the last few months. It’s the same generation-plus-cleanup pattern I ran into testing Abacus AI’s automated workflows, so I wanted to see whether the hype matched the output here too.

I gave it a detailed, multi-step prompt for planning and executing a marketing campaign — the kind of thing a real marketing coordinator would actually need. The first result was, to put it plainly, messy. Arrows overlapped, a few labels sat on top of each other, and the overall layout wasn’t something I’d hand to a client without fixing it first.

My first AI-generated attempt — technically correct, visually rough.
I then told the AI directly to clean up the arrows and stop them from crossing each other. The second pass was noticeably better — organized, readable, and close to something I’d actually ship.

Same diagram, one clarifying prompt later.
My take, and I’ll say it plainly: don’t expect a perfect diagram on the first try. Quality depends heavily on how well you describe what you want, and the smartest way to use this feature is to treat the first output as a rough draft you refine, not a finished product. This lines up with what I’ve seen reported elsewhere too — independent comparisons of AI architecture diagram tools published this year note the exact same pattern: overlapping labels and messy arrow routing on the first pass for anything with more than a handful of components. It’s not a Lucidchart-specific flaw, it’s a limitation of how these text-to-diagram tools currently work across the board. Lucid’s own assisted layout feature — which snaps AI-generated content into swimlanes, containers, and frames with one click — helps close that gap, and it’s worth using immediately after any AI generation rather than manually dragging things straight.
Formatting, Conditional Rules, and Staying Organized
Once I had a working diagram, I dug into formatting: fonts, sizes, text and background color, borders, alignment, rotation, corner rounding, opacity. You can multi-select and apply changes to a batch of objects at once, which saves real time once your diagram grows past a handful of shapes — the same kind of batch-editing convenience I liked when I reviewed Magic UI’s component styling for interface work.
The conditional formatting is where Lucidchart goes deeper than I expected. You can set a rule that adds an icon automatically when a shape hits a certain number of connections, and you can stack conditions — say, requiring a shape to have two connections and contain specific text before a rule fires. That’s overkill for a simple flowchart, but for something like an IT dependency map or a large process diagram, it’s a genuinely useful way to surface patterns without manually eyeballing every shape.
For staying organized at scale, you get object locking (so you don’t accidentally nudge something), grouping (so multiple elements move as one unit), and containers or swimlanes for sectioning a diagram into stages like “To Do,” “In Progress,” and “Complete.” These aren’t flashy features, but they’re the difference between a diagram that stays usable after six months and one that turns into a mess the moment more than one person touches it.
Where Lucidchart Actually Struggles
I don’t like publishing a glowing review without pressure-testing the complaints, so I deliberately pushed a diagram past 40 connected shapes to see what happens. Two things showed up that match what I found echoed in verified Capterra reviews from this year: connectors can insert unwanted bends when you move a shape instead of staying straight, and once a diagram gets visually dense, keeping it readable takes real manual effort — the spacing and alignment tools help, but they don’t fully automate it. This is the “pixel pusher” feeling I keep coming back to: for complex diagrams, you spend real time making things look neat rather than just thinking through the logic.
Integrations, Sharing, and API Access (Correcting a Common Myth)
Lucidchart connects deeply into the tools most teams already run: Atlassian’s Confluence and Jira, the full Microsoft stack including Visio import/export, Google Workspace, Slack, and — new this year — native MCP connections for Claude, ChatGPT, Cursor, and GitHub Copilot in VS Code, so you can generate or edit diagrams straight from an AI coding assistant’s chat window.
Here’s a correction I want to be upfront about, because it’s repeated across a lot of review sites and it’s simply out of date: Lucidchart does have a REST API. The Lucid Developer Platform exposes a documented API for creating, reading, and managing documents and folders, plus an Extension API for building in-editor add-ons and a SCIM API for enterprise user provisioning. What it doesn’t do is generate a diagram from a free-text prompt purely through the API — that’s currently a product-level feature, not an API-level one. If you’re evaluating Lucidchart for a developer-heavy workflow, that distinction matters more than a flat “no API” answer.
You can also share a finished document with granular permissions — view-only, comment, edit, or edit-and-share — and Lucidchart auto-saves as you work, so you’re not manually saving every few minutes. Presentation mode lets you show off a finished diagram without exposing the editing controls to whoever you’re presenting to.
Lucidchart Pricing in 2026

| Plan | Price | Best For | Key Limits |
|---|---|---|---|
| Free | $0 | Trying it out, students | 3 editable documents, 100 templates |
| Individual | $9/month | Solo professionals | Unlimited documents, 1,000+ templates, 1GB storage |
| Team | $10/user/month | Small teams (3+ users) | Advanced collaboration, Jira integration |
| Enterprise | Custom quote | Large organizations | SSO, automation, admin controls, SCIM provisioning |
A quick heads-up: pricing pages for tools like this shift more often than you’d expect, and third-party trackers occasionally list slightly older figures like $7.95 for Individual. I cross-checked the numbers above against multiple pricing trackers verified as recently as July 2026, and $9 / $10 is the figure that’s held consistently. I’m putting together a dedicated Lucidchart pricing breakdown that goes deeper into annual-vs-monthly billing and what each tier actually unlocks, so keep an eye out for that if you want the full cost picture before committing.
Lucidchart vs. Visio, Miro, Xmind, and draw.io
I’ve spent time in most of the major alternatives too, so here’s where each one actually beats Lucidchart rather than just competing with it on paper.
| Tool | Best For | Why Pick It Over Lucidchart |
|---|---|---|
| Microsoft Visio | Technical/engineering docs | Deep ISO-standard symbol libraries if you’re already locked into the Microsoft ecosystem. |
| Miro | Brainstorming, workshops | An infinite whiteboard beats a structured diagrammer when the ideas are still messy. |
| Xmind | Mind mapping | Auto-structures your thoughts as you type; Lucidchart still feels manual by comparison here. |
| draw.io (diagrams.net) | Cost-conscious teams | Free and open-source, though the interface is noticeably less polished. |
Pros and Cons After Weeks of Real Use
✅ What Held Up
- Drag-and-drop shape building is genuinely fast for standard flowcharts, org charts, and wireframes
- 1,000+ templates on paid plans save real setup time
- Additional shape libraries (like floor plans) mean you’re never boxed in
- Conditional formatting and data linking go deeper than most competitors bother with
- Visio file import (VDX, VSD, VSDM, VSDX) is a legitimate way off expensive Microsoft licenses
- Auto-save and version history — I never had to think about losing work
❌ Where It Fell Short
- AI diagram generator needs a follow-up prompt to clean up overlapping arrows on complex requests
- Templates open as new documents instead of inserting into your current one
- Connectors can add unwanted bends when you reposition shapes
- Large, dense diagrams take real manual effort to keep readable
- Free plan’s 3-document cap is limiting fast for anyone doing this regularly
- UML support has gaps for developers who need full syntax coverage
Who Should Actually Use Lucidchart?
If your team needs to start documenting processes, mapping an org structure, or building a shareable visual for stakeholders — this is the safe pick. It scales from a single freelancer sketching out client workflows up to enterprises running SSO and provisioning through SCIM. HR teams building out reporting structures are squarely in its comfort zone too — if that’s your use case, it’s worth pairing this with our roundup of the best AI HR software, and if compensation bands are part of what you’re mapping, our compensation management software guide is worth a look as well. Operations teams mapping workflows and IT teams diagramming architecture round out the rest of who this tool is really built for.
If you’re a developer who lives and breathes strict UML syntax, or a creative who finds the box-and-line structure limiting no matter what tool you’re in, it’s worth also looking at Xmind or a code-based diagramming approach before you commit. And if budget is the deciding factor over polish, draw.io is free and covers a surprising amount of the same ground.
My Final Verdict
After actually building diagrams in it rather than just reading about it, my opinion is settled: Lucidchart earns its reputation. It’s not the flashiest tool I’ve tested this year, and the AI generator won’t hand you a finished product on the first try, but the fundamentals — the editor, the template library, the collaboration, the conditional formatting — are genuinely solid, and the free tier is generous enough to actually evaluate before you pay a cent. Even outside diagramming, it’s the same lesson I keep relearning testing tools for this site — whether it’s Craft.do for documentation or an all-in-one SEO platform: the tools that stick around are the ones that get the unglamorous fundamentals right, not just the flashy AI feature on the pricing page. For the project manager who needs a workflow mapped and shared with stakeholders by lunchtime, Lucidchart is still hard to beat.
3 free documents, no credit card needed.
FAQ
Does Lucidchart have an API?
Yes. The Lucid Developer Platform provides a REST API for documents, folders, and collaborators, an Extension API for in-editor add-ons, and a SCIM API for enterprise provisioning. It doesn’t currently support generating a diagram from a free-text prompt through the API directly — that’s a product feature, not an API endpoint.
Is Lucidchart better than Visio?
For cross-device collaboration and cloud access, yes. For deep, ISO-standard technical libraries inside a Microsoft-only environment, Visio still holds an edge.
Can I import Visio files into Lucidchart?
Yes — VDX, VSD, VSDM, and VSDX files all import, which makes migrating off an expensive Visio license fairly painless.
Is Lucidchart’s AI diagram generator actually good?
It’s useful as a fast first draft, not a finished product. Complex prompts tend to produce overlapping arrows on the first attempt; a follow-up prompt or the assisted-layout tool cleans it up quickly.
Is Lucidchart free for students?
Often, yes — many universities provide Lucidchart Premium to students and faculty at no extra cost as part of their institutional licensing. Check with your school’s IT department to see if you already have access.
About the Author
Oyekale Olawale runs Websites2Know, an independent platform reviewing AI tools and SaaS software. He tests each tool across real workflows — not demos — and publishes reviews based on hands-on evaluation. Reviews are written independently; no vendors pay for favorable coverage.